| Administrator Handbook | Table of contents |
|
The SNMP Bulk Threshold Control plugin form LoriotPro allows you to set thresholds on sensitive network or system indicators (SNMP Object Identifier – snmp OID) for hundreds of hosts in few mouse clicks. You could configure in a single Window, hundreds of hosts, attach them snmp object and set threshold values for which you want to be warned.
The operating principle is simple, a reading at regular intervals of SNMP objects defined in the list is completed. The values are collected and compared to the values of positioned thresholds . When conditions are satisfied, an event is sent to the Event Manager of events LoriotPro. Then, just add filters on these events to trigger an action if necessary (sending mail, beep, SMS etc…)The threshold could be set on a SNMP oject of type string, counter, gauge or integer. Comparison operators allows you to define the condition that should be matched for sending an alarm..
The results are also visible from the WEB remote console if needed.
Templates of standard threshold configuration could be defined and applied to a host or a group of host. This option allow you to define a lot of Alarm thresholds in an few clicks.
With such tool, you could focus on the important events occurring in your Information system.
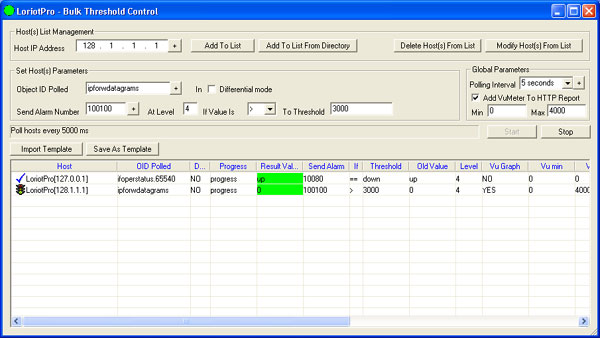
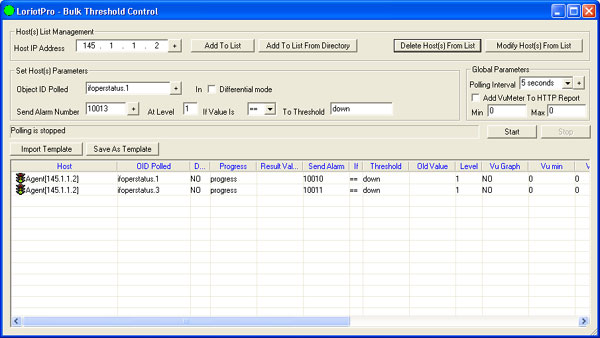
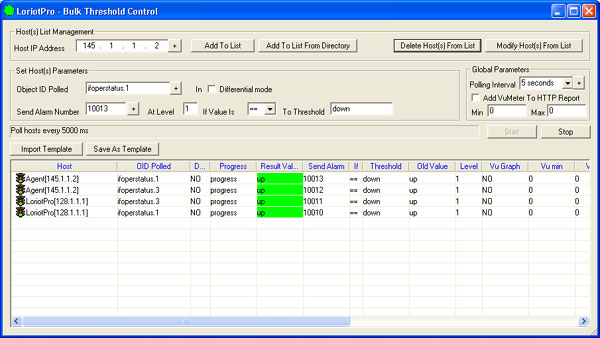
Hereunder, the main windows of the Bulk Threshold Control.
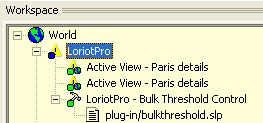
The installation of the Bulk Threshold Control Plugin is performed in the directory workspace.
Select one host in your directory and then from the contextual Menu select Insert Task and select the Bulk Threshold Control Plugin.
You should see the following result in your workspace.
We will present the configuration through an example.
Supposing that we have three hosts with two network interfaces each. We want to be notified if their operational statuses change to “down”.
First, we need to know at least the following information:
The first question “What snmp OID should we monitor and what the value could be” is not so easy to understand for people not used to works with snmp OID. snmp OID are objects defined in the MIB files and thus could be find using the MIB tree tab of the LoriotPro Workspace. At least, you should know aproximately in which branch of the MIB tree you could find the indicator (snmp OID) you want to poll.
Common snmp OID are defined in MIB II and a majority of indicator for almost
all technologies are located under this branch.
The first and fastest way for selecting the snmp OID is to use the WIZARD ![]()
Consult the WIZARD chapter for detail.
The second way is to select the snmp OID in the MIB tree.
Lets search the MIB tree and find our interface status indicator.
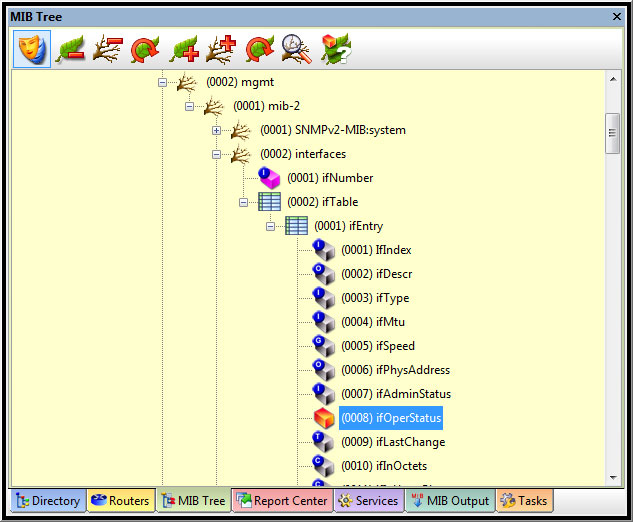
We find our indicator in the interface branch under interface table. The interface table contains for each interface a list of indicator (SNMP objects).
One of this is the ifoperstatus snmp object.
If we select with a click on the mouse right button the snmp OID property option, we could
gather the following information.
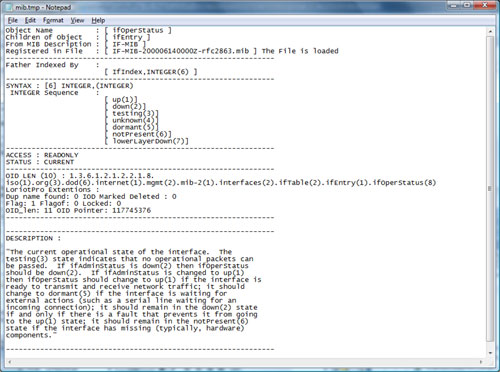
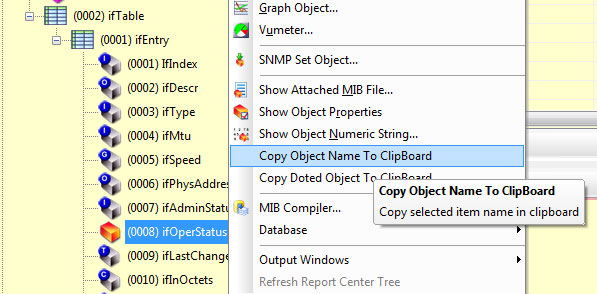
We could check with its description that the indicator is the right one and notice that the status could have three states (up, down, testing).
Before leaving the MIB tree Workspace we have to copy either the object
Name or its snmp OID to the clipboard from the contextual menu as displayed
below.
Then we come back to the Bulk Threshold Control window and paste the name or snmp OID in the Object ID Polled field. Then, we had if necessary the dot and the index value (here index 1).
![]()
In our example, the host has multiple interfaces, each one having an index. To gather the interface index values just start the common query tool and click on one interface. You will see the list of interfaces for that host and their respective index values.
The differential mode specifies that the value used for the threshold evaluation will be the difference between the current snmp OID value and the old value (the previous value). This option is very useful when you read SNMP snmp OID value of gauge type. These types of value are cumulative (like your car gas gauge). To know if it has change since the last time, you have checked it, you should compare the current value to the old value.
Most of the throughput indicators in SNMP MIB are of gauge type. To calculate
for example the throughput of an interface in Mbps using the ifInOctets
an ifOutOctets snmp OID you should apply the following formula:
(Current Value * 8) – (Old value*8) / Polling Interval
The 8 factor converts from Bytes to Bits and the Polling Interval division
does the average per second. The result is the throughput in MBps.
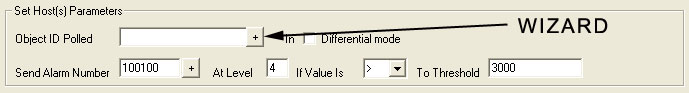
We should now set the other parameter.
The goal of our Plugin is to generate alarm when thresholds or states
are reached. We have to set the following fields:
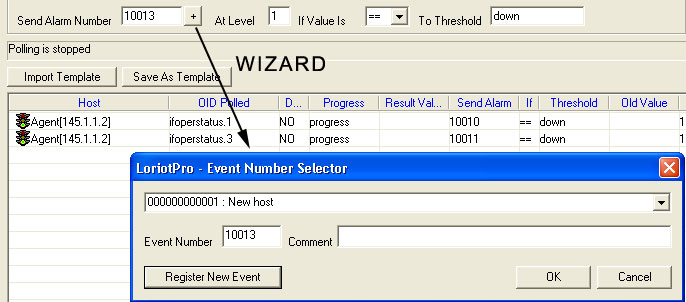
![]()
The Alarm number is set to something higher than 10000 and not already assigned. This number will appears in the event manager and allows you to do filtering.
The event WIZARD allows you to find an existing Event or create a new one. The Description text could be define also by this way in the comment field.
The At Level field helps you to define the importance of the event. Low level of gravity is 0, high level is 4 (red in the event manager).
The “If value Is” field allow you to select the condition
operator. The operator could be :
| == Is Equal | the value of the snmp object should be equal to the Threshold |
| > Is Greater than | the value of the snmp object should be less than the Threshold |
| < Is Less Than | the value of the snmp object should be greater than the Threshold |
| != Is Different | the value of the snmp object should be different from the Threshold |
| <= Is Equal or Less Than | the value of the snmp object should be inferior or equal to the Threshold |
| >= Is Equal or Greater than | the value of the snmp object should be superior or equal to the Threshold |
| ==. Become Equal | the value of the snmp object should become equal to the Threshold |
| >. Become Greater than | the value of the snmp object should become greater than the Threshold |
| <. Become Less Than | the value of the snmp object should become less than the Threshold |
| !=. Become Different | the value of the snmp object should become different from the Threshold |
| >=. Become Equal or Greater than | the value of the snmp object should become superior or equal to the Threshold |
| <=. Become Equal or Less Than | the value of the snmp object should become inferior or equal to the Threshold |
Warning: The first six options generates events when the collected values satisfy the conditions and thresholds. At each polling an event is sent if the threshold is reached. The last six options do generate the event only when the threshold is crossed.
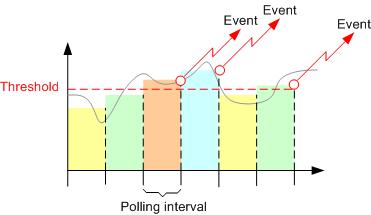
Below is an example of measurement of a snmp object of counter type . The differential option is checked, at each polling inteval the aggregate value (colored surfaces) is calculated.
If the condition "is greater than" is applied here, an event is generated at each polling for values above the threshold.
|
If the condition "Become greater than" is applied here, an event is generated only when the threshold is crossed .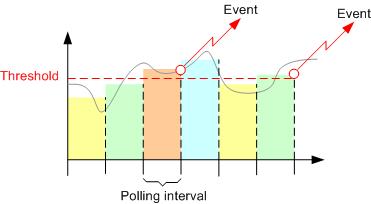 |
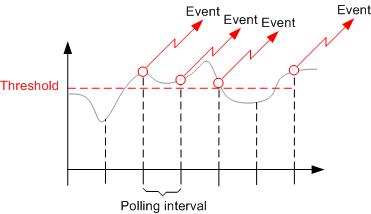
Below is an example of measurement of a snmp object of gauge type. The differential option is unchecked, at every polling interval the snmp object value is compared directly to the threshold.
If the condition "is greater than" is applied here, an event is generated at each polling for values above the threshold.
|
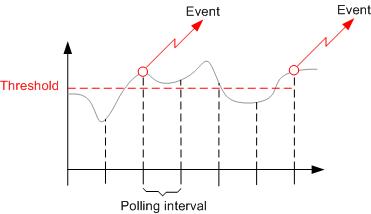
If the condition "Become greater than" is applied here, an event is generated only when the threshold is crossed.
|
The next field contains the threshold value. This field could be the numerical value or the string value (like here in our example).
Next step is to set the polling interval to which hosts will be polled. In Global parameter, Polling Interval, select a value.
We could now select the hosts to which we want to apply the previous defined parameters
You could add hosts to the list either manually by setting one by one the host IP address or you could pick them up in the Directory.
The second way is far most faster an support the shift and Ctrl selection in the list.
The last way is to use the Wizard by cliking on the + button, consult the chapter WIZARD
When this is done, we could see the hosts in the list.
We can now start the Polling process by pressing the Start button. The
Plugin starts to poll the hosts at regular intervals and display current
Threshold status.
From there, you could change a host or a group of host parameters. Select
it by double click on the list, the current parameters would appear in
the corresponding field, change what you want and apply the changes by
clicking the Modify Host(s) From List button.
Using Templates
A template allows you to applied an already define setting, some lines in the threshold list, to a host.
If you have define a setting that send an alarm like in the preceeding
example we could create a template from it.
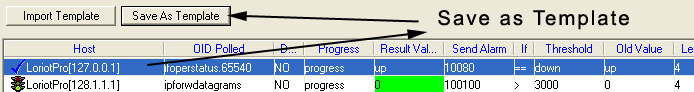
We first select a line or a group of lines (CTRL button) in the list and
click on the Save as template button.
The open dialog box asks you to enter a name for your template. Choose
one, the suffixe is btf is automatically appended.
To use the template, select a host and then click on the Import Template button. Choose the template file and select OK. A new line or set of line are added to the list.
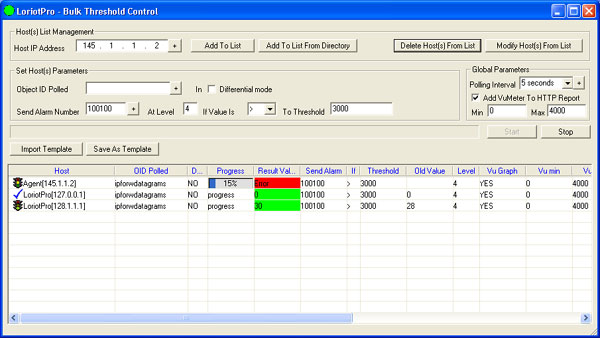
WARNING: In our example we choose an inedexed objet. If the Object is indexed you have to be sure that the same index exist in the new host to which you apply your template.The Bulk Control Threshold updates the Value field after each
polling. If the value field becomes red it means that the threshold or
status condition is satisfied. Then, the alarm is sent to the event manager.
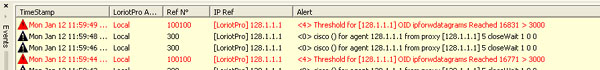
The threshold has been reached, the according event is displayed in the
event manager.
The information above could also be check remotely if you have started the LoriotPro WEB server (refer to LoriotPro documentation for setting this service).
You could access from a navigator your current table. A double click on the Bulk threshold (hammer) in the tree opens the table with the current state and values.
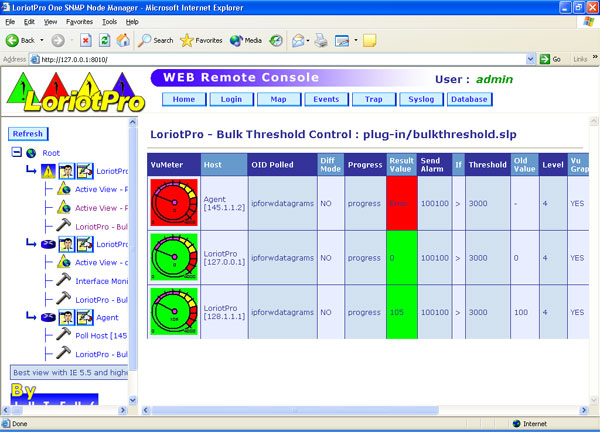
On the right side of the table you could had the Loriotpro Vu-meter. To have the Vu-meter check the box Add VuMeter to HTTP report in the Control. The Min and Max value displayed on the Vumeter could be specified.
![]()
This control is usefull is the indicator is a discrete value. In our example,
we choose a three state indicator thus VuMeter is here not worth.
|