| Administrator Handbook | TOC |
SNMP counter and gauge graphic
Introduction
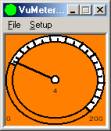
This LoriotPro directory Plugin displays a Vu-meter with the results of predefined SNMP requests of snmp counter or snmp gauge object. The object graph could be of counter type or Gauge Type. Counter are alway increasing value instead of the gauge type that reflects a level (almost like the fuel level in a tank).
Interface traffic statistics are typical snmp counter types and CPU usage statsistics are typical snmp gauge type objects.
The requests are sent to the host to which the Plugin is linked. This Plugin is also explicitly used by LoriotPro in some of its menus or in the MIB tree window.

Plugin LoriotGraphGauge3.slp
Lauching the Plug-in
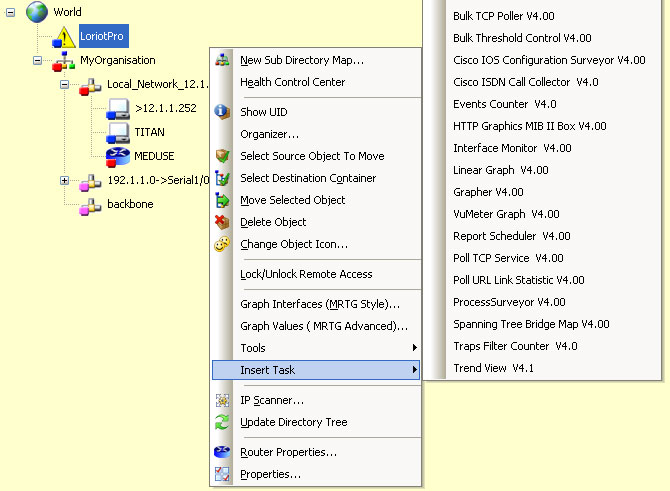
From the Host contextual menu select Insert task -> vumeter SNMP value. Or from the same menu select the option Vu Meter graph.
Configuration
Use theSetup option of the window to configure the Plugin.

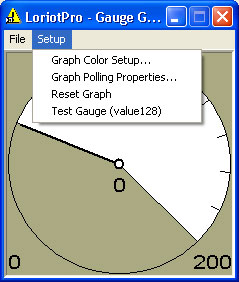
From the menu select :
Setup>Graph Color Setup…
Color configuration for the graphics.
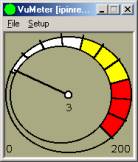
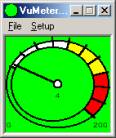
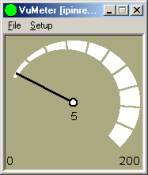
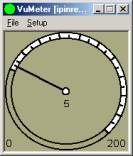
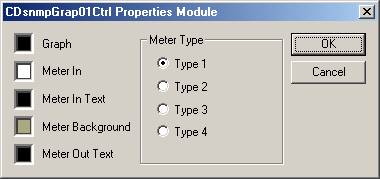
Table of VU meter
| Vu-meter types |
Examples |
| 1 |
|
| 2 |
|
| 3 |
|
| 4 |
|
Setup>Graph Polling Properties…

In our example, the ipinreceives SNMP object has been selected.
The Refresh Time in milli seconds is the interval between each SNMP polling.
The Min and Max value define the value display on the graph at the left and right side of the scale.
The Differential Check Box is used when the OID is of counter type. In this case the value displayed is the difference between the current value and the preceding value divided by the elapsed time between each measure.
The No Differential check box is use with OID of gauge type. Value of gauge type are directly displayed.
To know the type of an OID you can check it with the wizard.
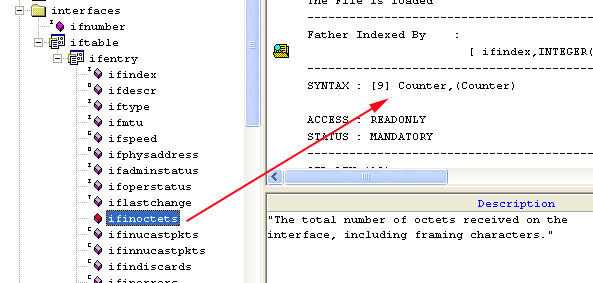
snmp counter object
A good example of gauge OID is the Number of process or CPU utilization OID.
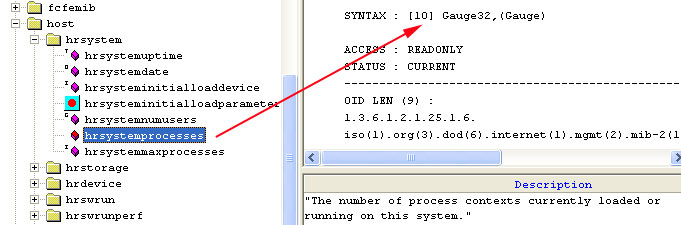
snmp gauge object
The Alert parameters allows you to send an event to the LoriotPro event manager when the value reach a specified threshold.
|