| Administrator Handbook | Table of contents |
|
The SNMP standard mode, the first tab in configuration mode
allows you to rapidly setup a collect of data and RRD graphs based on SNMP
requests. The RRD database is automatically and transparently created.
The only thing that you have to know is what SNMP objects that you want to graph are. A wizard will help you to choose in a template tree the SNMP object or directly in the MIB tree.
After the database initialized the graph will start to be
updated.
This mode generates 5 graphs that display the trends of the collected SNMP objects.
Once the database is initialized there is no way for modifying the setup parameters.
The SNMP standard tab looks like this when it is the first time that you access it.
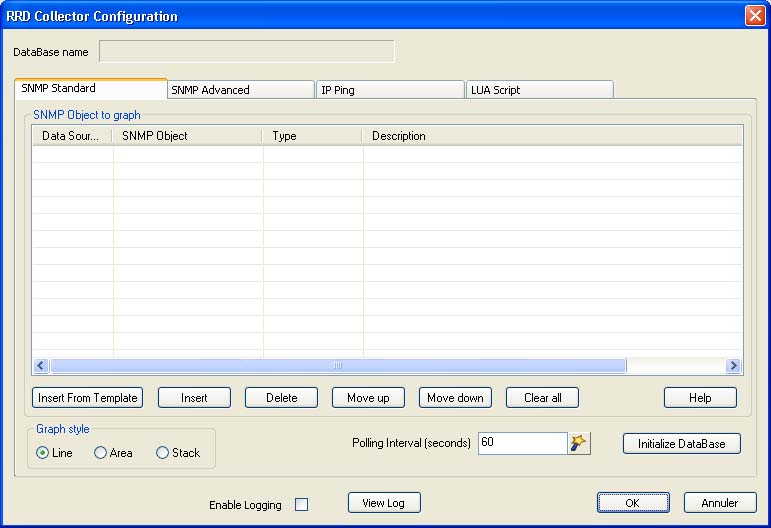
The SNMP object to graph table should be filled with the SNMP objects and their index. This object should be available in the LoriotPro MIB tree, MIB files should be compiled.
To add object in this table you have the choice between the
Insert From Template button or the insert button.
The Insert From Template will help you to select what you want
to graph in an organized tree of SNMP resources. This is easier but the template
doesn’t contain all available objects by default. The template list is
defined in an XML file that you can edit.
The Insert button allows you to choose the objects one by one
in the MIB tree.
If you choose the Insert From Template Button you access
the MIB Table selector wizard.
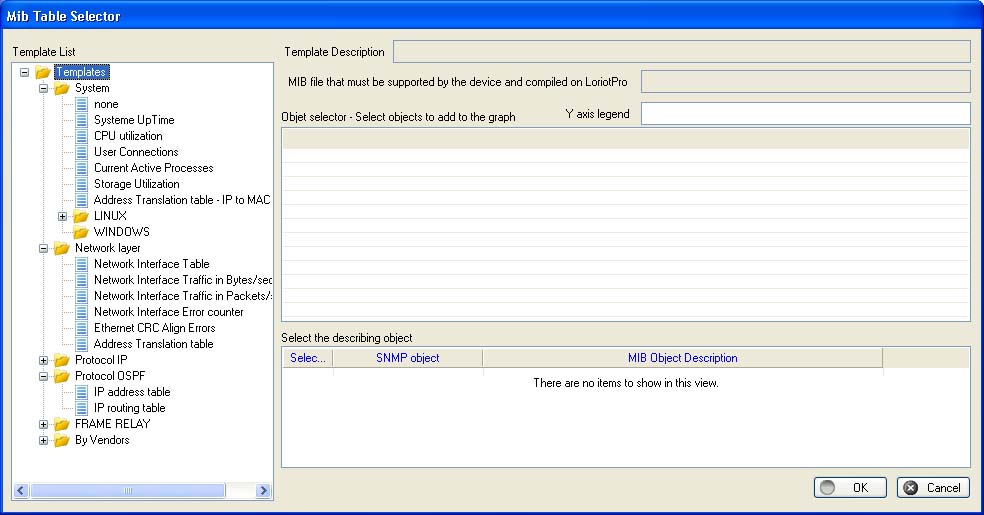
The MIB Table selector wizard displays the RRD template tree on its right side. If you select a template in this tree the SNMP objects of this template will be displayed in the Object selector pane. If the table is empty it means that this object table is not supported by this host or the host is not responding to SNMP requests.
We choose in the following example « Network
interface traffic in packet ».
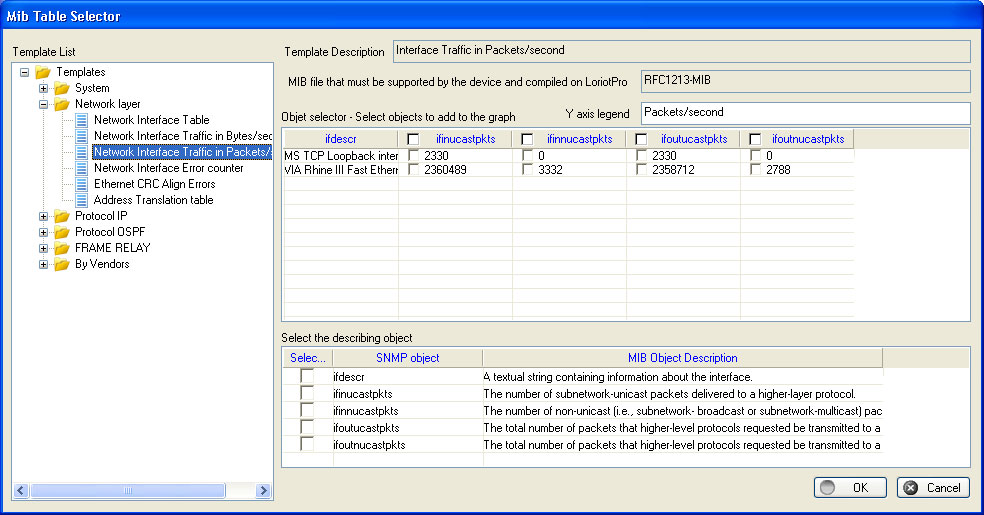
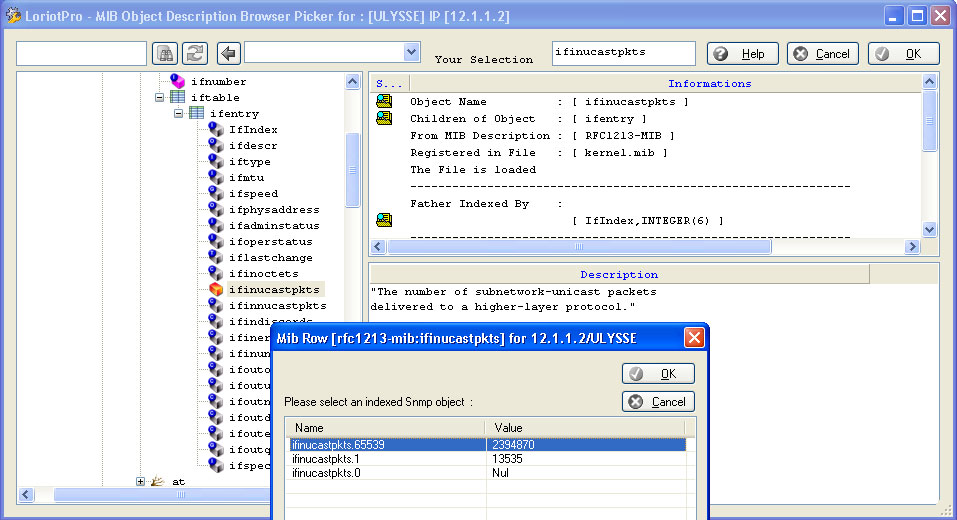
The SNMP object that you can collect and graph with
RRD are display with a check box. Check the objects that you want to graph.
In the lower pane you can select one SNMP object that will be used to describe
the data to graph.
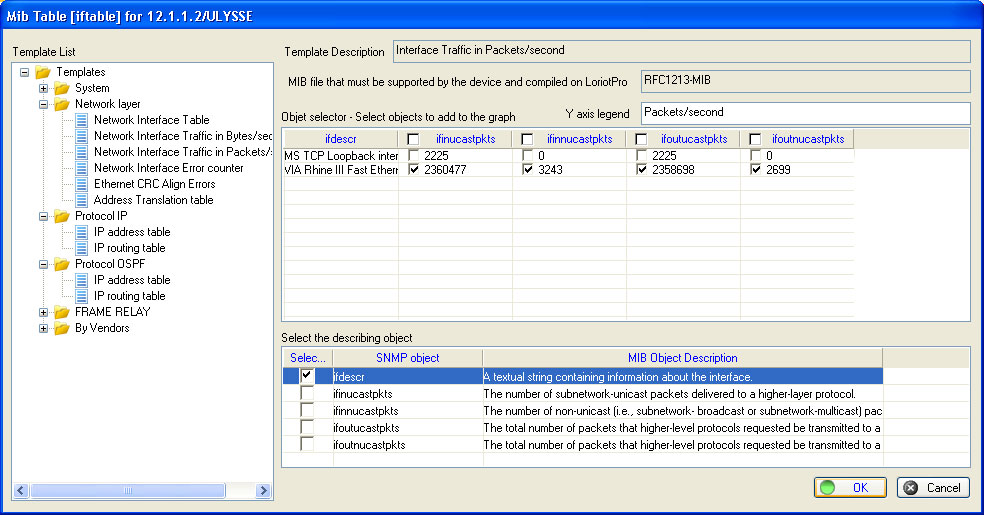
When you have selected the snmp objects click OK, the table is filled automatically.
The second way of selecting snmp object is the Insert button. The SNMP Object ID selection window is displayed
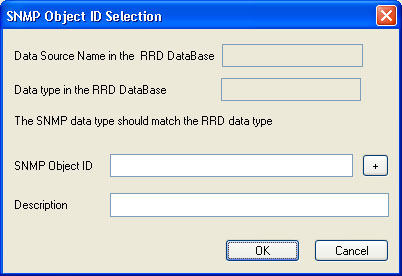
You can enter the snmp oid in short or fully qualified format with its index (example : ifinucastpkts.65539)
Or click the + button to open the MIB tree selection wizard
Proceed to the same step for each snmp object that yopu want to add to the RRD graph.
When you have selected the snmp objects click OK, the table is filled automatically.
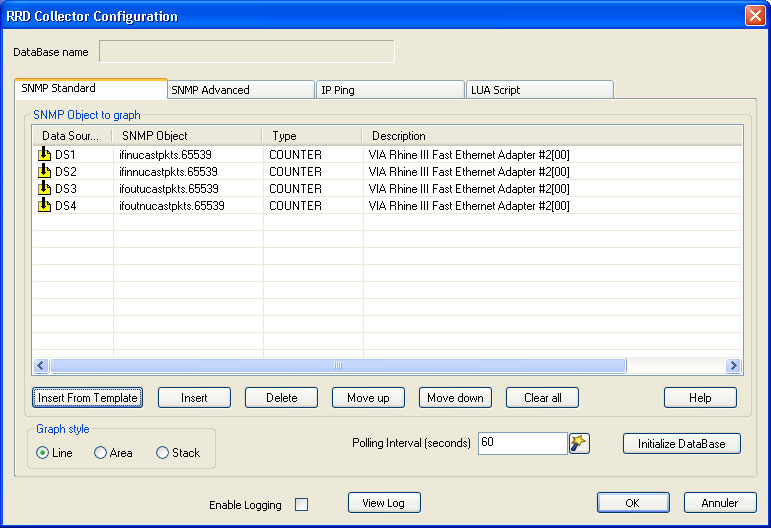
The first column contains the Data Source Name. The Data Source Name is used in the RRD Database to uniquely identify each data collection.
The SNMP object column contains the snmp oid in short format. You can also use the intermediate format supported by LoriotPro. The intermediate format is composed of the MIB description name and the snmp name separated by semicolon (example: RFC1213-MIB:ifinucastpkts.65539).
The Type column contains the data type (gauge, counter, integer) read from the MIB. This value is very important for RRD when making consolidation of data.
At this step it is possible to change the order of the Data Source with the Move Up and Move Down buttons. If you use the AREA graph style it could be useful to order the Data Source from the lowest values to the highest values.
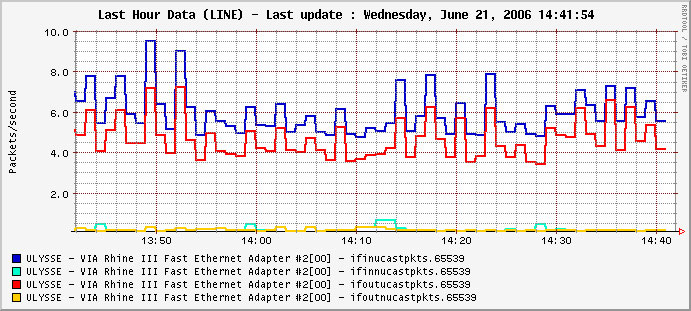
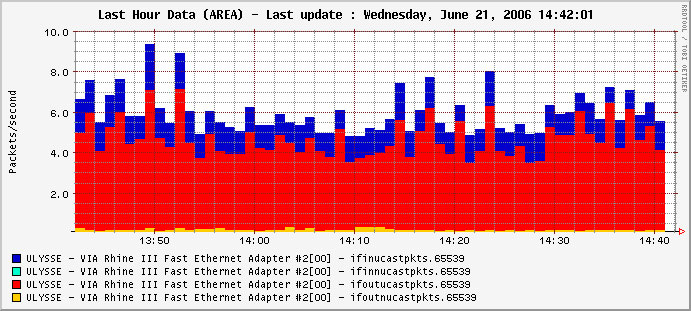
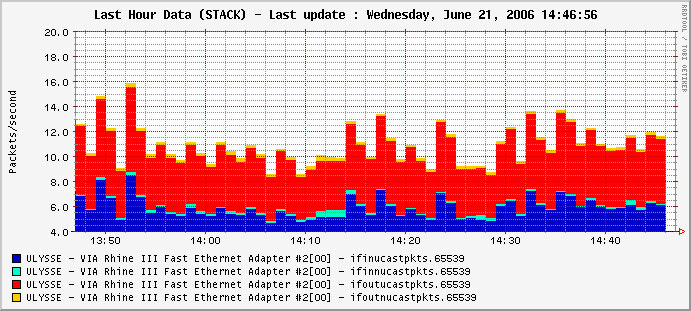
You can select the Graph Style between the following three styles
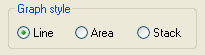
The available styles are :
LINE : Data are display as line in the graph
AREA : Data are display as area in the graph
STACK : Data are stacked in the definition order in the graph
The polling interval allows you to choose the frequency of the polling. If you choose interval higher than 2 mn the Hourly graph will not be displayed. We recommand to let the default of 1 minute.
When you have finished and chosen the parameters you must click on the Initialize DataBase button
![]()
Depending of the version of RRD Collector apopup is displayed with the RRD creat command.
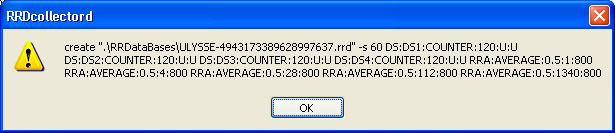
This command can also be seen in the log file if log is activated in the configuration windows.
When the DataBase is created is is not possible to go back. The plugin has to be deleted if you want to recreate a new database for these SNMP objects.
You can now quit the configuration window and start the data collection. After 2 polling you should see the first data graphed on the right side of the hourly graph.
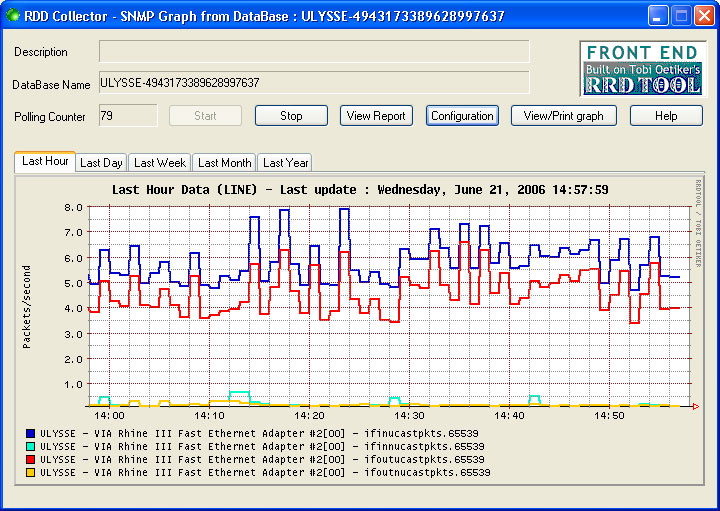
To display the graph select the tab.
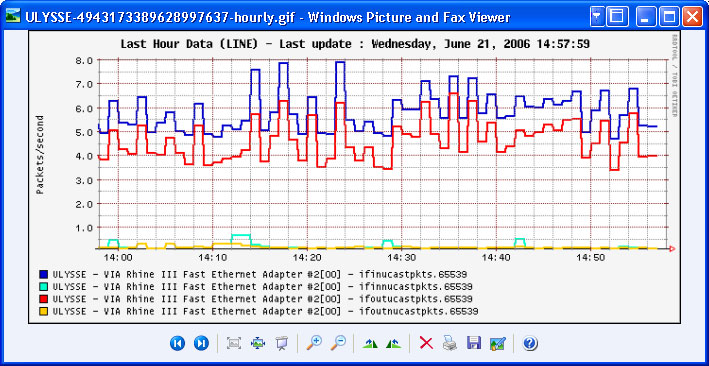
You can also print each graph individually. Click the Viw Print Graph button.
The graph is display in your preferred image viewer.
You can also see all the graph in a web report style.
Click on view report.

This report is also available form the remote LoriotPro WEB console
|