| Administrator Handbook | Table of contents |
|
Expressions items are used to create new item in a RRD graph that are the result of a mathematical expression applied on data source items. For example, instead of having two items in a graph, one representing an incoming traffic and another representing an outgoing traffic, you might generate an expression item that sums both values and graph it.
The RRD mathematical expressions are written in Reverse Polish Notation (RPN). If you have ever used a traditional HP calculator you already know RPN. The idea behind RPN notation is, that you have a stack and push your data onto this stack. When ever you execute an operation, it takes as many data values from the stack as needed. The pushing of data is implicit, so when ever you specify a number or a variable, it gets pushed automatically.
To create expression items, you should have first defined the Data Source Items that will be used in the expression. Select the Expression Items tab to access the list of expressions items below.
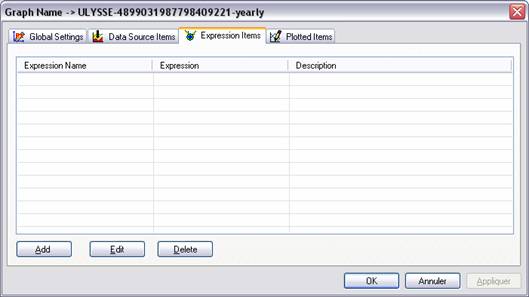
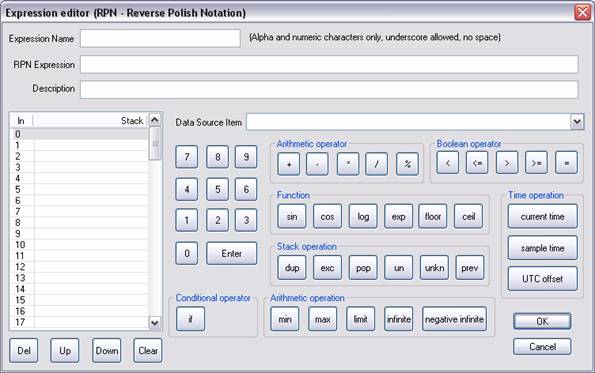
Click on the Add button. The expression editor is displayed.
Define a name for your expression and a description.
Next you should define the expression itself. If you already known how to create the expression then simply enter the expression in the RPN expression field.
If no, you can use the set of buttons to create the expression. Each time that you click on a button the new operator will be added onto the stack (left table).
For example, the expression 4,5,+ adds 4 to 5.
The expression 4,5,6,+,/ adds 4 to 5 and divide the result by 6.
To create this expression click successively on the following button :
4 ENTER 5 ENTER 6 ENTER + /
You should get this result in the Stack :
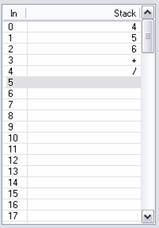
And get the RPN expression 4,5,6,+,/
This is example RPN expression should contain at least one Data Source Item else they will not be interpreted and no graph will be created.
Below more explanations on the role of each button:
|
|
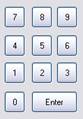
A keyboard that allow you to enter Integer value, the value is push onto the stack when the Enter button is clicked. |
||||||||||
|
|
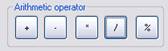
Arithmetic operators
|
||||||||||
|
|
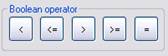
Boolean operators
|
||||||||||
| Functions |
|||||||||||
| SIN |
Sinus |
||||||||||
| LOG |
Logarithm |
||||||||||
| COS |
Cosines |
||||||||||
| EXP |
Exponential |
||||||||||
| FLOOR |
The floor functions round a floating point number to the nearest integer below. |
||||||||||
| CEIL |
The ceiling functions round a floating point number to the nearest integer above. |
||||||||||
| Stack manipulation |
|||||||||||
| dup |
Duplicate the last element on the stack |
||||||||||
| exc |
Exchange (swap) the last two elements of the stack |
||||||||||
| pop |
Remove the last element |
||||||||||
| un |
Remove the last element if it is unknown |
||||||||||
| unkn |
Add the UNKOWN element onton the stack |
||||||||||
| prev |
Push *UNKNOWN* if it is the first value of a data set otherwise push the value of this data source at the previous time step. This allows you to perform calculations across the data counter for example. |
||||||||||
| MIN |
Select the minimum value among two values (ex : 24,34,MIN retourne 24) |
||||||||||
| MAX |
Select the maximum value among two values (ex : 24,34,MAX return 34) |
||||||||||
| LIMIT |
Replace the value with *UNKNOWN* if it is outside the limits specified by the two values above it on the stack. (ex : DS2,20,30,LIMIT set the value to UNKNOW if DS2 is lower than 20 or greater than 30) |
||||||||||
| INF |
Push a positive infinite (oo) value onto the stack. When drawing an infinite number it appears right at the top edge of the graph. |
||||||||||
| NEGINF |
Push a negative infinite (oo) value onto the stack. When drawing an infinite number it appears right at the bottom edge of the graph. |
||||||||||
| Curent Time - NOW |
Push the current (real world) time onto the stack. |
||||||||||
| Sample Time - TIME |
Push the time the current sample was taken onto the stack. This is the number of non-skip seconds since 0:00:00 January 1, 1970. |
||||||||||
| UTC Offset - LTIME |
This is like TIME + current timezone offset in seconds. The current offset takes daylight saving time into account, given your OS supports this. If you were looking at a sample, in Zurich, in summer, the offset would be 2*3600 seconds, as Zurich at that time of year is 2 hours ahead of UTC. Note that the timezone offset is always calculated for the time the current sample was taken at. It has nothing to do with the time you are doing the calculation. |
The stack element can be manage with the DEL UP DOWN CLEAR buttons.
DEL : clear the selected line
UP : move one line up the selected line
DOWN : move one line down the selected line
CLEAR : clear the all stack
Examples of expressions
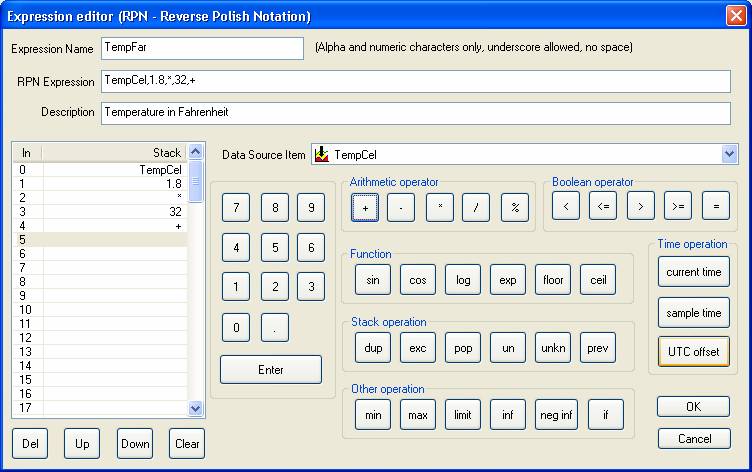
In this first example the Data Source is the temperature of a sensor collected in Celsius degrees. We want to have two items in the graph one in Celcius the other in Fahrenheit.
The Data Source Item is named TempCel and the Expression Item is called TempFar
After configuration we get a similar expression item edition screen
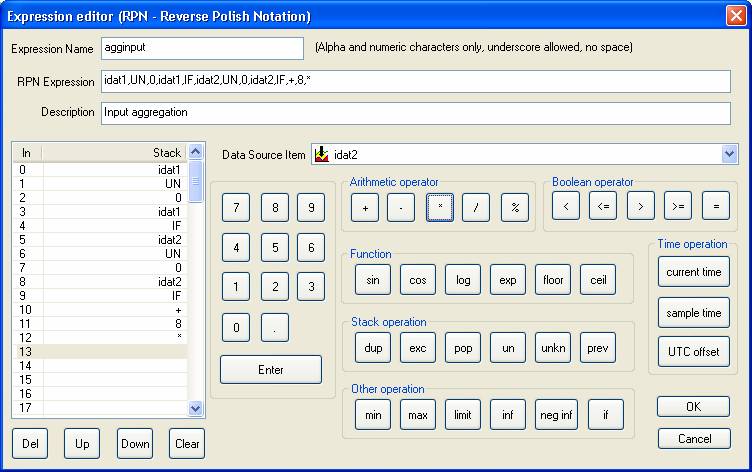
Second example
This example demonstrates the syntax for using IF and UN to set *UNKNOWN* values to 0. This technique is useful if you are aggregating interface data where the start dates of the data sets doesn't match. Assuming that idat1 has no data value (UNKNOWN), the CDEF expression idat1,UN,0,idat1,IF leaves us with a stack with contents of 1,0,NaN and the IF function will pop off the 3 values and replace them with 0. If idat1 had a real value like 7942099, then the stack would have 0,0,7942099 and the real value would be the replacement.
Then the same test is realize on idat2, both result are summed and multiply by 8 to get results in bits/second.
|