Graph of TCP connection response time with RRD et LUA
Introduction
Creation of RRD graph of TCP connection response time
Introduction
LoriotPro and
RRD collector module offers the measurement and display trend of response time (
TCP connect) using RRD and LUA. The purpose of this chart type on
TCP response times is to detect quality degradation of the response time to the demand for connections from clients. The configuration of the TCP response time collection is set either by IP address or server URL and by specifying a
TCP port. A set of RRD graphs display the trends over the last hour, last day, last week, last month, last year .
Note: In case the request is a URL, the time resolution of the url into an IP address (DNS) will be included in the RRD graphs. It usually has an impact on the first step then becomes negligible when the address is in the local cache of Windows.
The implementation of such measure and graph is explained in this document.
Creation of RRD graph of TCP connection response time
Creating a graph from RRD LUA script opens endless possibilities for generating graphic trend. The simple principle implementation is to take as a source the values given by a script in LUA language and enrich the RRD database and use them for the generation of trend graphs, load, response time etc..
The GUI RRD Collector can create unlimited new graphs from existing scripts. With the
LUA script editor you can create your own scripts and then exploit them with RRD Collector. Consult the documentation on the LUA scripting for the creation script.
In our example we use an existing script dedicated to measuring
TCP response times .
A LUA script default accepts 3 input arguments (lp_host, lp_oid, lp_index) and returns two output values (lp_value and lp_buffer).
To create a graph of
TCP response time you must first attach the plugin RRD Collector to a host directory and then access the configuration.
In the configuration screeen select the LUA Script tab.
From there, you must create one entry for each server/application TCP response time value that you want to have in your graph
Click on Insert to add your first entry. A Script selection dialog box is displayed. This one allow you to select one script in a list. The list ofscript can be extended with your own script.
To be see in the list the script should follow a particular syntax header and should be post in the directory /bin/config/script/RRDscript.
The script expects some incoming parameters to run depending of its goal. The return values are use to create the graph line itself.
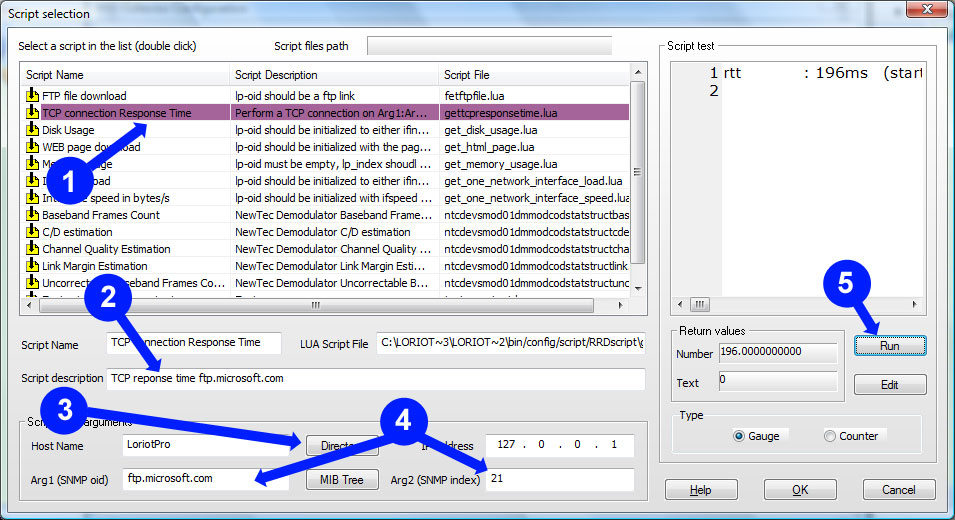
How to specify the parameters
- You must first select the script in the list. To measure a TCP connect response time select the script TCP Connection Response Time.
- Script description: Specifies the type of argument to provide to the script. This field must be replaced because it will be used as a legend in the graph.
- Host Name: The host name of the directory if it is necessary for the script to make his requests. In the case of the script this name and address are not used, then use the default LoriotPro and the loopback address 127.0.0.1
- Arg1 (SNMP oid): This must be either the URL of the server or its IP address. Arg2 (SNMPindex): This must be the TCP port where the TCP connect is done. You can use the netstat command on the remote server for discovering the TCP ports or use the SNMP Common Query tool of LoriotPro and look for the TCPconn table for a list of TCP listening ports. You can also click on the icon of the host in the directory to display the popup windows and display the TCP connection table.
- Once defined the argument, one clicks the Run button to verify the proper functioning of the script with the arguments provided.
Repeat this selection for each server application (TCP port) to add to the RRD graph. Example below with 4 entries on 4 servers and different applications (FTP,WEB,MAIL)
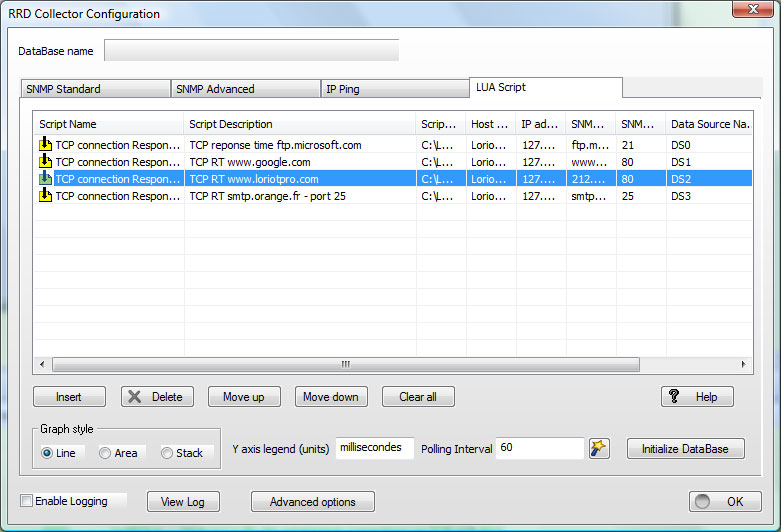
Before leaving, you must choose the type of value returned by the script to make the graph.
Leave the default choice Gauge: The variable is displayed as such in the graph.
If the result retruned is good (not 0), click 'OK', a collection of entry is inserted in the list (RRD database).
Repeat for each curve of your graph and for each TCP measure you want in this graph.
Once all your entries are set but before initializing the RRD Database, Choose:
- the legend of the Y axis,
- The polling interval (minimum 30 seconds)
- and curve type (Line, Area, Stack).

Perform a Initialize Database.
Note that action creates the definitive RRD database. The database structure cannot be changed later on without repeating all the settings from the beginning.
In the plugin directory can then be renamed to be more easily indetifiable. Click on the text field to enter edit mode.
Double click on the plugin open the plugin window.
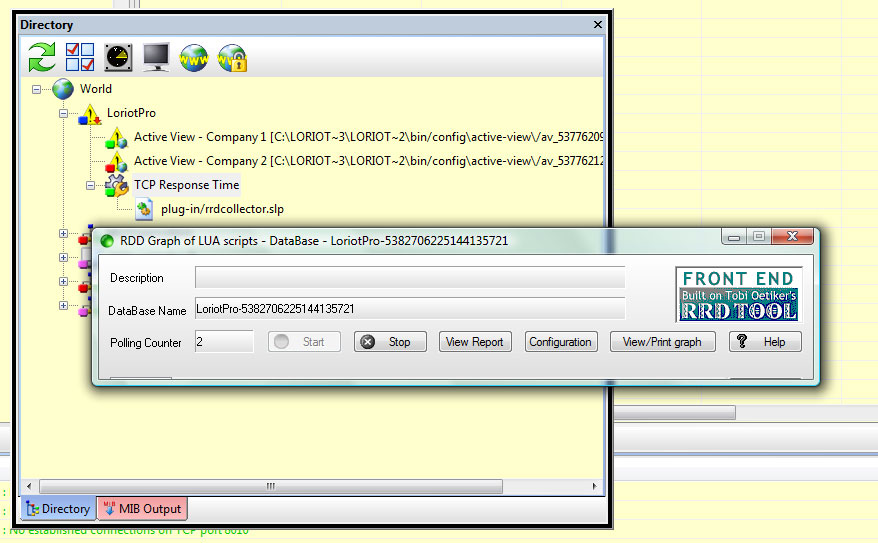
You should Start the collection.
Then after 1 minute, you can request a display of your graphs with the View Report button.
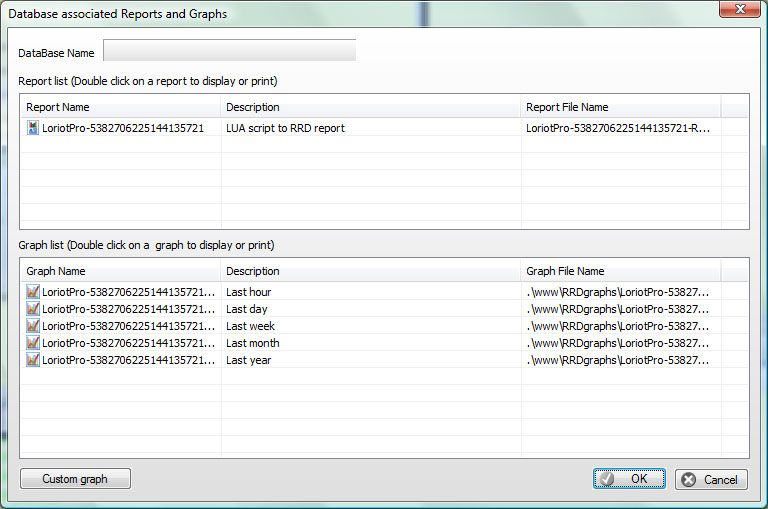
Select either the HTML report view with the 5 graphs or select on of the graph.