| Administrator Handbook | Table of contents |
|
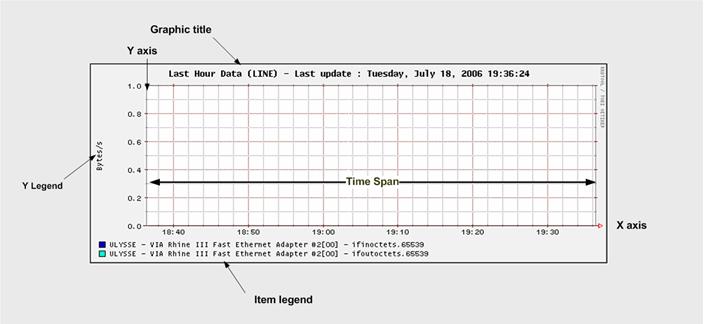
The global properties of a RRD graph profile allow you to change the visual appearance of a graph.
Each RRD graphics has the following settable attributes:
Graphic title, Y axis legend, Y axis scaling, width, hight and a time span define by astart date/time and a end date/time.
You can access the the global properties of a graph in the graph process creation or, if the graph profil already exist, directly from the rrd manager, graphic configuration interface.
Select the Global Settings tab to defines the graph mandatory parameters.
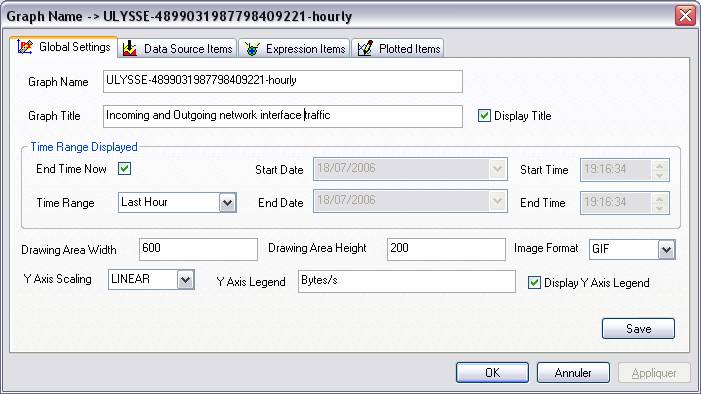
Details of RRD graph settings options are given in the following table
| Graph Name |
A unique name that identify the graph in the profile |
| Graph Title |
A title displayed at the top of the graph |
| Display title |
Allows you to remove the title from the graph |
| End Time now |
The graph defines a time span on its Y axis. If the box is check the time of the right point will be always the current time. |
| Time Range |
If you have selected now, the graph will display a time span based on your selection |
| Start Date and Start time |
Allow you to define the start date and start time of the graph (the left time value on the Y axis) |
| End Date and end Time |
Allow you to define the end date and end time of the graph (the right time value on the Y axis) |
| Drawing Area Width |
The graph is an image with a height and a width that can be changed |
| Drawing Area Width |
The graph is an image with a height and a width that can be changed |
| Image format | The image file format (GIF or PNG) |
| Y axis Scaling |
The Y axis value can be displayed on a linear or logarithmic scale. |
| Y axis legend |
You can define the legend of the Y axis. We usually specify the unit |
| Display Y Axis legend |
Allow you to remove the Y legend from the graph |
When you have set the graph to the apprioate settings you should click the Save button before quiting or selecting another tab.
|