| Administrator Handbook | Table of contents |
|
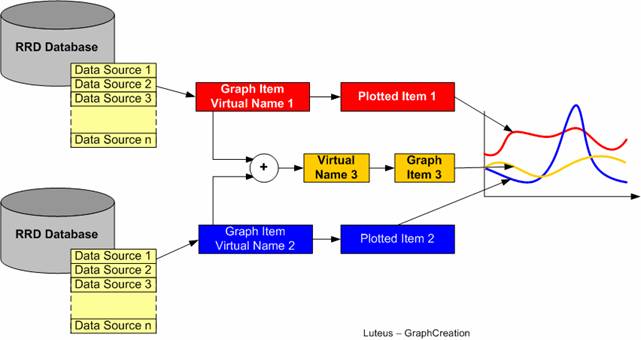
The Data Sources of a RRD Graph are extracted from one or multiple RRD Databases. Each Data Source that we want to extract and add to a graph should be associated to a graph item. This item receives a virtual name that is use as a reference and plot directly in the graph or as an input of a RPN mathematical expression (see next chapter).
In the drawing below, we use the data sources of two different RRD databases to create two graph items. This graph items are plot directly into the graph (blue and red). A third item is created from these two items. The third item is the result of a mathematical expression applied on these two items.
To create a new graph item enter in graph Item edition mode. Enter a graph item name “Virtual Name” and select the database RRD and a Data source in this database. Graph item names are arbitrary defined but we do use the same name as data source name when possible.
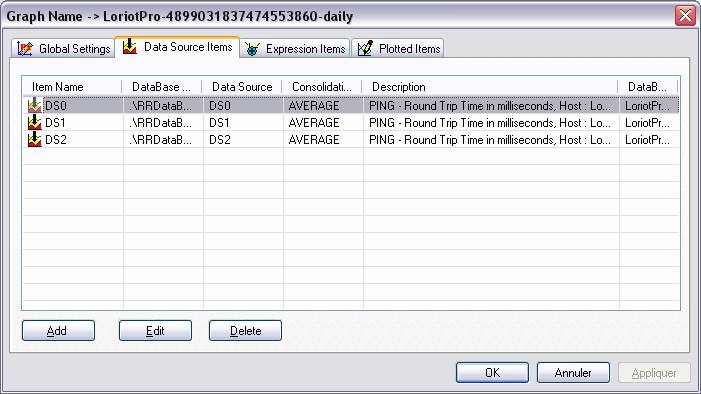
How to create a new graph items (Virtual Name)
You should select first the Data Source items of the graphic profile user interface.
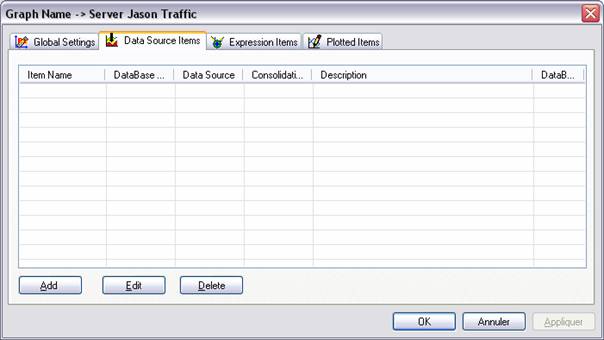
Then click on the Add button. The following dialog box is displayed :
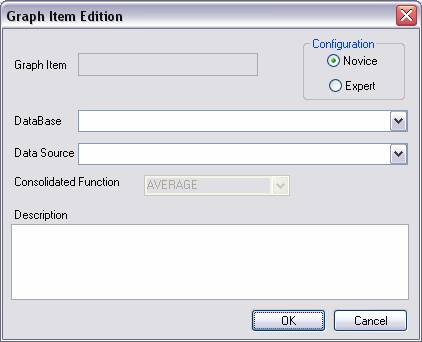
If your are not an expert leave the novice mode enable.
You have to select first the RRD database from where you want to read data.
Select the Data Source among the list of data sources available in this database.
In novice mode the default consolidation function AVERAGE is selected (arithmetical average).
In novice mode the name and the description assigned to the graph item will be the same as those of the data source.
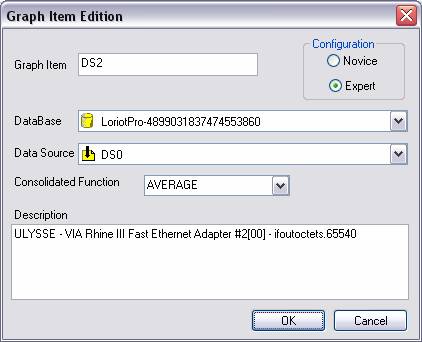
In expert mode you can choose the name and the consolidation function to use among the the list below:
| Consolidation function |
As arithmetical operation apply on a set of data (primary data points -PDP). AVERAGE : Sum of the data divided by the total number of data. LAST : Last data of the set of data MAX : The maximum value in the data set MIN : The minimum value of the data set |
The consolidation function is uses only if the number of value in the archive over the considered period is higher that the number of point two show in the graph.
In option, you can change or add a description to this entry.
Repeat this operation for each graph item that you want to add to the graph or required for further calculations with the RPN expression.
The data source in the following screenshot are read in the same RRD Database which is always the case if the entries are created by RRD collector in SNMP standard and Ping mode.
|