| Administrator Handbook | Table of contents |
|
This documentation page of the LoriotPro Software concerns the WEB interface of the product.
In addition to its graphical interface in Windows™, the LoriotPro software integrates an HTTP server and thus offers a multi-user GUI in a WEB interface. The data collected by the software in SNMP or by other means are accessible via this interface. Numerous charts, histograms, tables, assist you and give you information of states and of performance on the infrastructure monitored
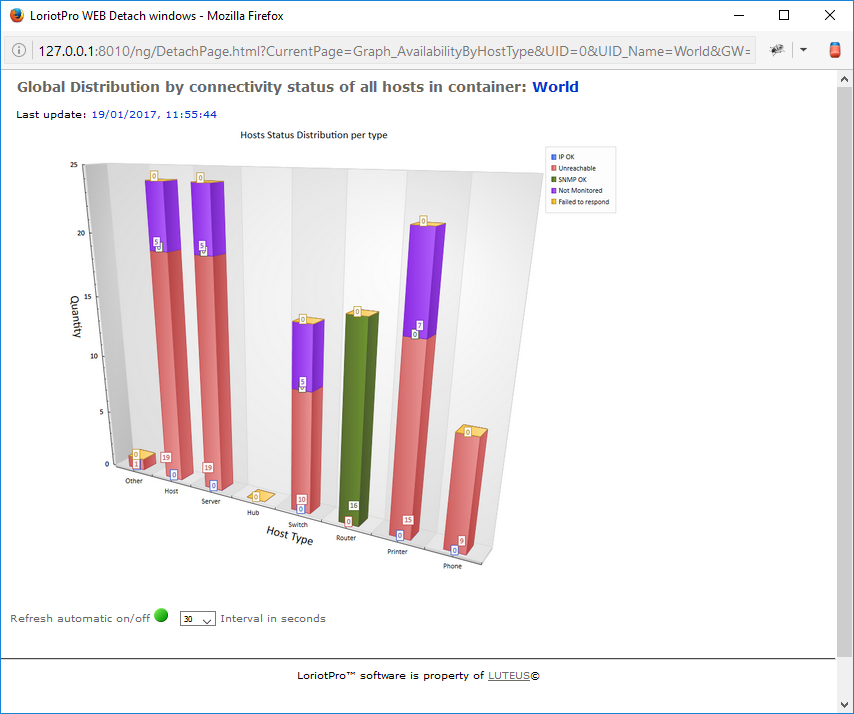
This menu option displays an histogram chart of the IP and SNMP connectivity states of all devices monitored on the selected container and classified by Type.
An internal process to LoriotPro provides scheduled queries at regular intervals of all the hosts of the directory (Directory). This is the Polling Process.
From the responses, the statuses are defined to display the level of IP and SNMP connectivity between LoriotPro and a host
Hosts declared in the directory have an associated type that also determines the icon used. The type is either detected by SNMP and SysService object or manually associated during setup.
The pie chart below provides a summary view of the connectivity status of all hosts in the selected container and their type.
The following types can be distinguished:
Type |
Icon |
Description |
AutoHost |
|
The type of auto discovered and if possible the correct icon is associated else the default following icon is associated. |
Host |
|
Probably a workstation |
Server |
|
Server of file, database, web, etc. |
Hub |
|
Network equipment type HUB Datalink (couche OSI 1) |
Switch |
|
Network equipment type router Datalink (couche OSI 2) |
Router |
|
Network equipment type switch |
Printer |
|
Printer |
Phone |
|
IP phone |
|