![]()
![]()
Administrator
Handbook
www.loriotpro.com
|
Administrator
Handbook |
TOC |
Trend View
Introduction
The goal of Trend View, a Windows MRTG front end (based on rateup), is to make graphics of the trend of two SNMP objects either of counter or gauge type. You can graph almost all OID objects like network interface traffics, CPU usage, disk usage, printer queue usage, E-mail queue usage, WEB traffic etc…
This Plug-in program uses the well known concept of MRTG and one of its software components (rateup.exe) for creating the graph. MRTG stands for Multi Router Traffic Grapher, details on this project are available on the Web at http://people.ee.ethz.ch/~oetiker/webtools/mrtg/. We could consider that this program acts rather like a frontend of MRTG.
Remark: This plug-in is an alternative to the embedded Graph Interface MRTG style option available since Version 1 of Loriot. You can still use this graph tool and Trend View simultaneously. Both software use rateup.exe program to create graph and log snmp oid values. The first one allows you to graph only network interface traffic and has no customization option.
If you still want to use the old solution don’t forget to check the option use PNG version of rateup in the menu Configuration->MRTG style graph process window.
The Trend View Plug-in generates report in an html format and provided result as 4 graphs.
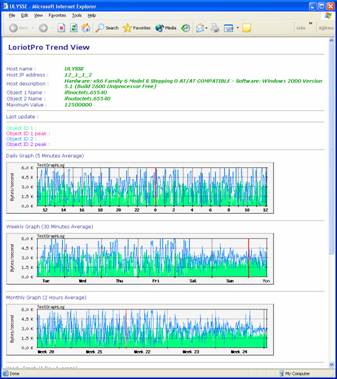
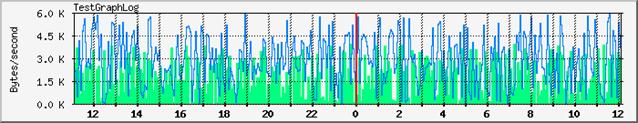
one that displays the trend of the last 24 hours, sampling interval is 5 mn.
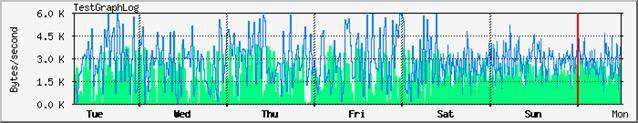
one that display the trends of the last week, sampling interval is 30 mn.
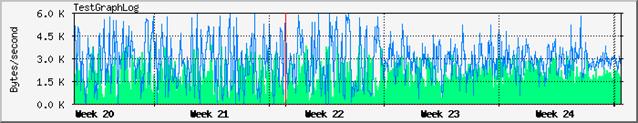
one that display the trends of the last month, sampling interval is 2 hours.
and one that displays the trends of the last year, sampling interval is 24 hours.
Configuration options allow you to customize the look of the graphics and the WEB report. The trend Report is also accessible from the LoriotPro remote console.
The Trend View Plug-in is a directory Plug-in and should be attached to a host in the directory tree.
The minimum sampling interval for the daily graph is fixed to 5 minutes. The set of collected data of the last day is stored in a file that contains all the samples and also the results of the consolidated data.
Consolidation is done on the following rules.
The sampling interval for the week representation is 30 minutes.
The sampling interval for the month representation is 2 hours.
The sampling interval for the year representation is 24 hours.
The SNMP Object to graph could be set individually by using the OID selection Wizard or selected from a template. Templates store common set of OID peer with other required information for a correct display.
Prerequisite
Trend View uses a software component of MRTG called rateup.exe. This software has two main roles. First it is used to store the collected data in a log file and make the consolidation of the data based on their average in ever increasing laps as mentioned before (30 mn, 2 hours etc.). Second it creates the 4 images in png format used in the report.
The rateup.exe program should be present in the /bin subdirectory of LoriotPro for Trend View having running. If it is not the case a pop up dialog box is displayed asking you to install or download it.
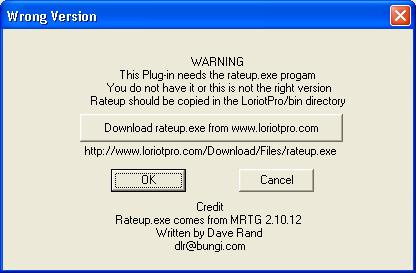
We get the rateup.exe program from MRTG version 2.10.12 which is available for downloading on the MRTG official WEB site : http://people.ee.ethz.ch/~oetiker/webtools/mrtg/.
MRTG as open source software is not available with LoriotPro package by default. We provide with Trend View only a frontend to the rateup.exe provided in the MRTG package.
Configuration
When the plug-in is attached to a host in the directory, it can be configured and started.
If a first set of graph is available (after one or two polling) a single click on the plug-in will automatically open the web navigator and the report. Else the properties dialog box will be displayed.
The properties dialog box allows you to set all the required parameters. Additional options are available if you want to change the default look of the report and of the embedded graphics.
The main and minimum job to do when configuring the Trend View plug-in is to select the SNMP object to graph and the type of these objects (Gauge or Counter).
![]() The selection could be done directly
from the MIB tree with the wizard selection tool
The selection could be done directly
from the MIB tree with the wizard selection tool ![]()
![]()
![]() or from a template list.
or from a template list.
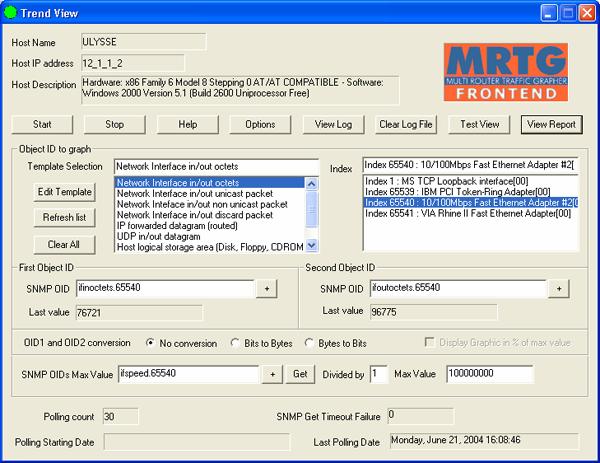
In our example below the objects and their index are selected with the wizard or within a template
Templates allow you to rapidly select common SNMP objects set without knowing where to find it in the MIB tree.
The step to follow for selecting SNMP OID from template is simple. First select in the Template Selection list one of the templates. If the template contains indexed object LoruiotPro queries the host and retrieve the list of SNMP objects and their index.
You should select the index of the object by a click in the index list. Your selection is automatically duplicated in the SNMPOID field.
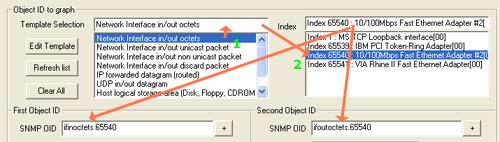
When two SNMP OID are selected you can define a conversion rule. By default no conversion is applied
![]()
The next entries allow you to specify the maximum value for oid1 and oid2. If a maximum value is specified, collected value for OID1 and OID2 that are upper this threshold will not be add to the graph.
![]()
When possible, the max value can be collected from a third SNMP object. In our example we read the SNMP OID ifspeed value that gave us the maximum value of the interface. As this value is in bits/second and we collect Bytes seconds we have to change the maximum value by a factor of 8. The maximum value that can be collected on our Ethernet 100 Mbps is 12 500 000 Bytes/second.
The last information that we can see in the main property dialog box are counter and status boxes.
The Polling count displays the number of SNMP get performed on OID1 and OID 2 since the last time we start the Plug-in either by an action on the start button or by a complete start of LoriotPro.
The SNMP Get TimeOut failure gives the number of unsuccessful SNMP Get performed on OID1 and OID 2 since the last time we start the Plug-in either by an action on the start button or by a complete start of LoriotPro.
The Polling starting date gives the date of the start of the Plug-in either by an action on the start button or by a complete start of LoriotPro.
The Last polling date gives the date and time at which the last SNMP polling occurs.
Starting and managing Trend View
The following set of actions is available with trend View
|
|
Start the collection of SNMP OID 1 and OID 2 on the host. Collected value are store in the file no graphics are yet generated |
|
|
Stop the collection of data |
|
|
Display this help file |
|
|
Open the advanced option dialog box that allows the setting of the html report look, the graphics size, legend and more. |
|
|
Display the content of the OID1 and OID2 value log file. |
|
|
Clear the content of the log and all the attached graph files |
|
|
Generate a dummy report with random value for the setting of the report look. |
|
|
Display the html report by generating graphs with the current values stored in the log. |
Configuration options
The options button opens a second dialog box interface and allows you to better customize the details of your report.
The first set of options allows you to modify the Html report look.
The top of the report shows:
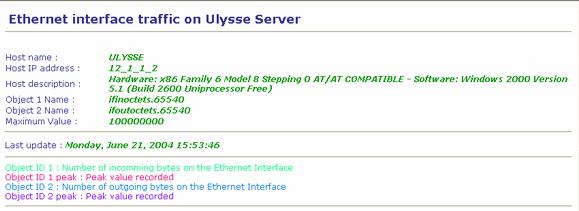
The host name as it is defined in the LoriotPro directory.
The host IP address as it is defined in the LoriotPro directory.
The host description got from the sysdesc mib2 SNMP object.
The object name and its index used as first OID.
The object name and its index used as the second OID
The maximum value allowed for OID1 and OID 2.
Last update provide the date of the last polling
Follow the legend of the graph with their associated colors.
The information displayed there can be individually removed from the final report. A check box in the advanced configuration allows you to choose what has to be displayed.
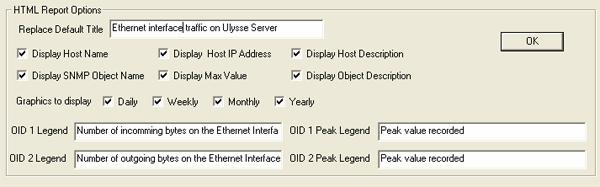
You can also choose to remove one or some of the 4 graphs from the report.
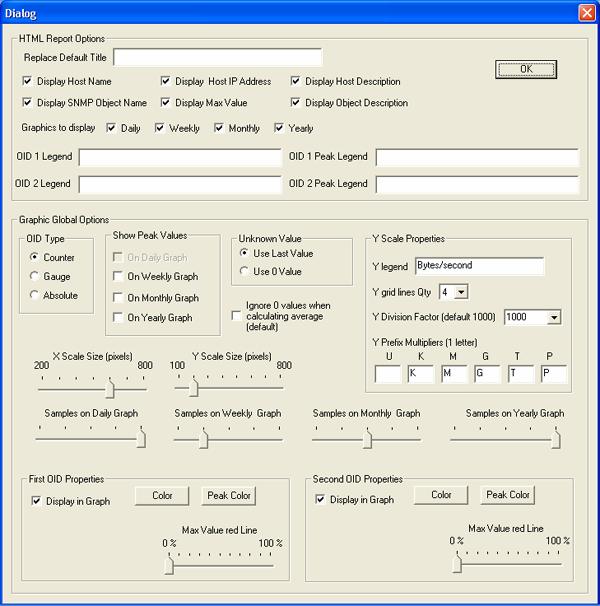
The second set of options, Graphic Global Options, allows you to define the look of the graphics within the reports.
OID Type
The OID Type is a very important option and should be correctly set. If you choose a template entry, the template set the value for you, but if you set an entry manually or from the wizard you should set the type manually.
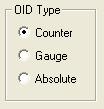
It defines the way the graph is built according to the SNMP oid typz. OID can be of counter or gauge type. Check how the OID is defined in the mib to know what is the correct setting here.
If you select gauge the value will be directly reported in the graph as is without modification. Intermediate peak behaviors that have occurred on the value between two polling interval are never seen.
If you select counter the values reported in the graph are the result of the difference between two consecutive readings averaged on a 5 mn interval. Peak values are present in the counter but most of the time lost in the average calculation.
If you select absolute the values reported are the last readings averaged on a 5 mn interval. This option is used when the SNMP agent clears the value each time a read is performed.
Remark: Sometimes the oid value is already a calculated value (like the cpu usage in the last five minutes) and need to be considered as a gauge even if it looks initially like a counter.
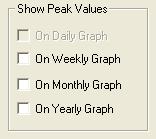
Displaying Peak Value
On the Weekly, Monthly and Yearly graph it is possible to add to line displaying respectively:
In the weekly graph the maximum value recorded among 6 samples in a 30 minutes interval.
In the monthly graph the maximum value recorded among 4 samples in a 2 hours interval.
In the yearly graph the maximum value recorded among 12 samples in a 24 hours interval.
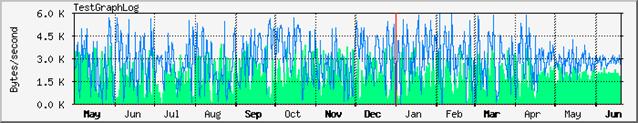
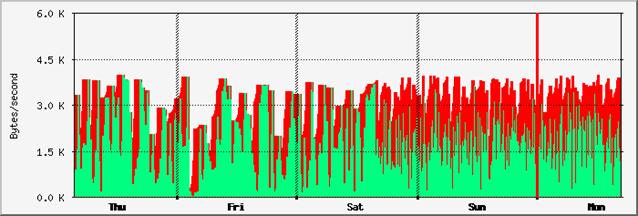
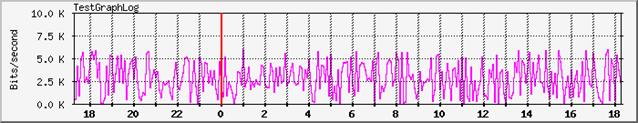
An example of weekly graph with peak values of the OID 1 only.
Managing dummy SNMP readings
If the SNMP request returns dummy or unknown values the graph has to display something instead. You can choose to display the same value as the last red value or display the value as 0.
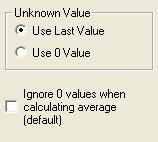
The second option is off by default and removes the 0 value when doing average calculation.
Managing the graph Y scale
The graph Y scale and legend is customized according to the following settings.
The Y legend is displayed vertically on the left side of the Y scale.
The y grid line Qty defines the number of horizontal lines displayed in the background grid of the graph.
The Y Division Factor set the value by default at which the y value are divided and rounded.
Example 10000 will be shown as 10 K.
Y Prefix Multiplier changes the default K (Kilo), M(Mega),G(Giga),T(Tera),P(Peta) letters use to define the unit of the Y values.
Graph size
The graph can be sized in height and width. Minimum and maximum are predefined.
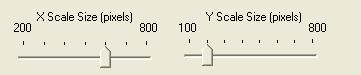
By default the graph has a width of 600 pixels and a height of 200 pixels.
The number of samples to show in the graph is also settable for each of them.
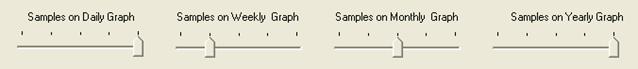
Changing the default values can lead to ugly graphs.
Graph line properties
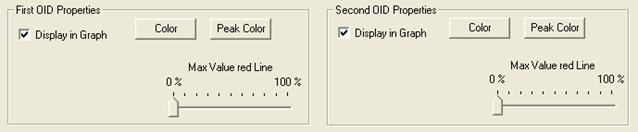
The Display in Graph option allows you to remove one SNMP OID from the graph. This option is useful when showing peak value to have clear graphs.
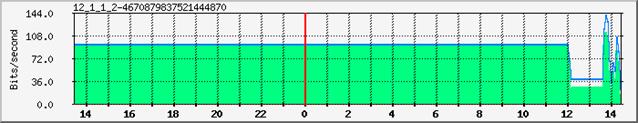
Max Value red line adds a red line in the graph indicating the maximum value than can be reached by OID1 and OID2. The Y scale is automatically set for displaying the maximum possible value and not only adjusted to the maximum read value (autoscale function of rateup).
In the example below, the Max Value red Line have been set to 100 % for an Ethernet interface at 100 Mbps. As we choose to convert Bytes to bits we have a direct reading of the interface usage.
The color of each line of the graph can be change at this level by selecting a color for the values and the peak values.
The OID1 will be always looking like a filled line graph and the OID2 as a line graph.
The OID 2 as a line graph
Testing the look of your customization
The test button is here to help you to define the look of your report, after changing parameter you could immediately get a view of what will be your future reports.
Creating a new template
Templates allow you to create predefined report for frequently used OID set. Templates are defined in a text file that is browsed automatically when you open the Trend View Plug-in. You can add you own template to the existing list.
Templates are stored in a readable file located in the /bin/config/trenview subdirectory. To add a new entry in the template list you should manually edit the template.
The structure of a template entry should be strictly respected.
// This file is used by the LoriotPro Trend Analyzer Plug-in
// The file
is use to fill the Template list box of the Plug-in and other pre configuration
//
// You can add or modify this template but follow the writing rules below:
//
// 0 - templateline : template line should start by this keyword imperatively
other line type are comments
// 1 - Description : The description that will appear in the list box
// 2 - Firstoid : The first SNMP Object ID to graph
// 3 - Secondoid : The Second SNMP Object ID to graph
// 4 - maxoid : The SNMP Object ID providing the maximum value that can reach
the first and second oid. if not available use none
// 5 - unitmaxodi : An integer multiplier for the conversion if necessary
octets->bits (by default should be 1)
// 6 - oidtype : the type of Object (counter, gauge, absolute)
// 7 - indexedobject : indicate if the object pertains to a SNMP Table object
(option : indexed or notindexed)
// 8 - indexdescription : An object of a SNMP table that best describe the
table entry.
// 9 - ylegend : the legend to display on the Y axis of the graph
//
//
//templateline;description1;firstoid1;secondoid1;maxoid1;unitmaxoid1;oidtype1;indexed;ylegend1
//templateline;description2;firstoid2;secondoid2;maxoid2;unitmaxoid2;oidtype2;notindexed;ylegend2//templateline;description3;firstoid3;secondoid3;maxoid3;unitmaxoid3;oidtype3;notindexed;ylegend3
//;;;;;;;
| Network Interface in/out |
Graph the total number of octets received and sent on a network interface, including framing characters. |
| Network Interface in/out unicast |
Graph the number of subnetwork unicast packets delivered and received to a higher-layer protocol |
| Network Inteface in/out non unicast |
Graph the number of non-unicast (i.e., subnetwork-broadcast or subnetwork-multicast) packets delivered and reiceved to a higher-layer protocol |
| Network Interface in/out discard |
Graph the number of inbound packets which were chosen to be discarded even though no errors had been detected to prevent their being deliverable to a higher-layer protocol. |
| IP forwarded datagram |
Graph the number of input datagrams for which this entity was not their final IP destination, as a result of which an attempt was made to find a route to forward them to that final destination |
| UDP in/out |
The total number of UDP datagrams delivered and received. |
| Host logical storage area (Disk, Floppy, |
Graph the amount of the storage represented by this entry that is allocated, in units of hrStorageAllocationUnits (cluster size) |
| Frame Relay DLCI in/out |
Graph the number of octets sent and received from this virtual circuit since it was created. Octets counted are the full frame relay header and the payload, but do not include the flag characters or CRC |
| Frame Relay DLCI FECN/BECN |
Graph the number of frames send and received from the network indicating forward congestion since the virtual circuit was created. |
| X25 circuit in/out octets |
Graph the number of octets of user data sent and received for an X25 circuit. |
| X25 incoming and outgoing svc |
Graph the number of active outgoing and incoming circuits. This includes call requests sent but not yet confirmed. This does not count PVCs. |
| SNMP in/out packets |
The total number of messages delivered or receive to the SNMP entity from the transport service |
| TCP active and passive connections |
Graph the number of times TCP connections have made a direct transition to the SYN-RCVD state from the LISTEN state (passive connection) and from the SYN-SENT state from the CLOSED state (Active Connection). |
| MTA received and transmitted mails |
Graph the number of messages received and sent since MTA initialization. |
| DNS authoritative & non-authoritative answers |
Graph the number of queries which were authoritative and non-authoritative (cached data) answered. |
| Host running processes |
The number of process contexts currently loaded or running on this system |
| WEB IN requests/responses |
Graph the number of incoming requests and responses to these requests |
| WEB OUT requests/response |
Graph the number of outgoing requests and responses to these requests. |
| WEB in/out bytes |
Graph the number of content bytes received and the number of content bytes transmitted |
| Ethernet single/multiple collisions |
Graph the count of successfully transmitted frames on a particular interface for which transmission is inhibited by exactly one collision and graph the count of successfully transmitted frames on a particular interface for which transmission is inhibited by more than one collision. |
| Cisco CPU usage |
Graph the CPU usage on Cisco Routers |
| NET-SNMP(LINUX) available memory |
Graph the available Real/Physical Memory Space on the host |
| NET-SNMP(LINUX) used/available disk space |
Graph the available space on the logical disk |
| NET-SNMP(LINUX) user/system CPU usage |
Graph the percentages of user and system CPU time. |
Trend View in depth
Trend View generates graphs with the collected value of OID1 and OID 2.
Each host in the directory get when created a unique UID, a large number that identify it among other. The report and graph attached to a Trend View plug-in is built with this number and stored in the /bin/www/mrtg subdirectory.
This subdirectory contains also the log file with the collected OID1 and OID 2 values.
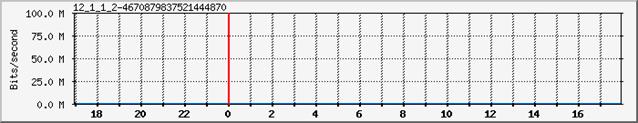
To find the set of files used by a plug-in look at the report and read the upper left value.
here we get 12_1_1_2-46700879837521444870.
If we look at the /bin/www/mrtg subdirectory we found the following files:
| 12_1_1_2-4670879837521444870-day.png |
Graph of the current day |
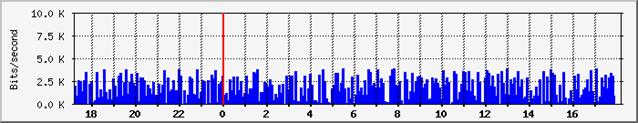
| 12_1_1_2-4670879837521444870-week.png |
Graph of the current week |
| 12_1_1_2-4670879837521444870-month.png |
Graph of the current month |
| 12_1_1_2-4670879837521444870-year.png |
Graph of the current year |
| 12_1_1_2-4670879837521444870.log |
Values for OID1 and OID2 used for creating the 4 graphs |
| 12_1_1_2-4670879837521444870.old |
Previous log |
| 12_1_1_2-4670879837521444870-TrendReport.html |
Report file in html format |
|