| Administrator Handbook | Table of contents |
|
But RRD graphics are built from data extracted from a RRD database. RRD tool has also the ability to create and feed this database. RRDTool stores data; that makes it a back end tool. The RRDTool command set allows the creation of graphs; that makes it a front end tool as well. Other databases just stores data and can not create graphs.
The structure of an RRD database is different than other linear databases. Other databases define tables with columns, and many other parameters. These definitions sometime are very complex, especially in large databases.
RRDTool databases are primarily used for monitoring purposes and hence are very simple in structure. The parameters that need to be defined are variables that hold values and archives of those values.
Being time sensitive, a couple of time related parameters are also defined.
Because of its structure, the definition of an RRDTool database also includes a provision to specify specific actions to take in the absence of update values.
Data Source (DS), heartbeat, Date Source Type (DST), Round Robin Archive (RRA), and Consolidation Function (CF) are some of the terminologies related to RRDTool databases.
In case of linear databases, new data gets appended at the bottom of the database table. Thus its size keeps on increasing, whereas size of an RRDTool database is determined at creation time. Imagine an RRDTool database as the perimeter of a circle. Data is added along the perimeter. When new data reaches the starting point, it overwrites existing data. This way, the size of an RRDTool database always remains constant. The name ``Round Robin'' stems from this attribute.
RRD databases store the values as supplied. RRDTool can be configured to calculate the rate of change from the previous to the current value and store this information instead.
RRD databases get updated when values are supplied. The RRDTool database is structured in such a way that it needs data at predefined time intervals. If it does not get a new value during the interval, it stores an UNKNOWN value for that interval. So, when using the RRDTool database, it is imperative to use scripts that runs at regular intervals to ensure a constant data flow to update the RRDTool database. In our case LoriotPro takes care for feeding the DataBase at regular intervals.
RRD create trend grah with consolidation functions.
You may log data at a 1 minute interval, but you are also be interested to know the development of the data over the last year. You could do this by simply storing the data in 1 minute interval, for one year. While this would take considerable disk space it would also take a lot of time to analyze the data when you wanted to create a graph covering the whole year. RRDTool offers a solution to this problem through its data consolidation feature. When setting up an Round Robin Database (RRD), you can define at which interval this consolidation should occur, and what consolidation function (CF) (average, minimum, maximum, last) should be used to build the consolidated values. You can define any number of different consolidation setups within one RRD. They will all be maintained on the fly when new data is loaded into the RRD.
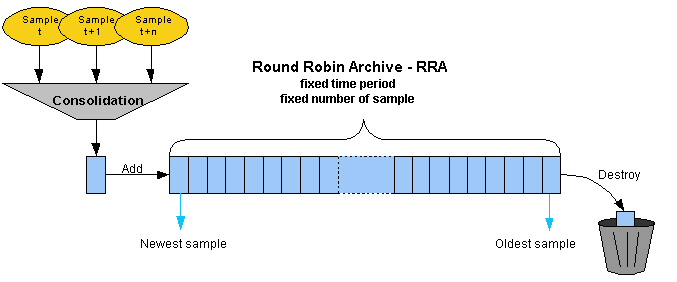
RRD store the consolidated values in Round Robin Archives
Data values of the same consolidation setup are stored into
Round Robin Archives (RRA). This is a very efficient manner to store data for
a certain amount of time, while using a known amount of storage space.
It works like this: If you want to store 1000 values in 5 minute interval, RRDTool
will allocate space for 1000 data values and a header area. In the header it
will store a pointer telling which one of the values in the storage area was
last written to. New values are written to the Round Robin Archive in a ...
you guess it ... round robin manner. This automatically limits the history to
the last 1000 values. Because you can define several RRAs within a single RRD,
you can setup another one, storing 750 data values at a 2 hour interval and
thus keeping a log for the last two months although at a lower resolution.
The use of RRAs guarantees that the RRD does not grow over time and that old data is automatically eliminated. By using the consolidation feature, you can still keep data for a very long time, while gradually reducing the resolution of the data along the time axis. Using different consolidation functions (CF) allows you to store exactly the type of information that actually interests you. (Maximum one minute traffic on the LAN, minimum temperature of the wine cellar, total minutes down time ...)
There are 4 type of consolidation functions
| AVERAGE |
Average |
Take the arithmetic average of the collected values |
| LAST |
Last read value |
Take the last collected value |
| MIN |
Minimum read value |
Take the smallest collected value |
| MAX |
Maximum read value |
Take the highest collected value |
Graph creation with RRD Tool
Another important feature of RRDTool is its ability to create graphs. The ``graph'' command uses ``fetch'' command internally to retrieve values from the database. With the retrieved values, it draws graphs as defined by the parameters supplied on the command line.
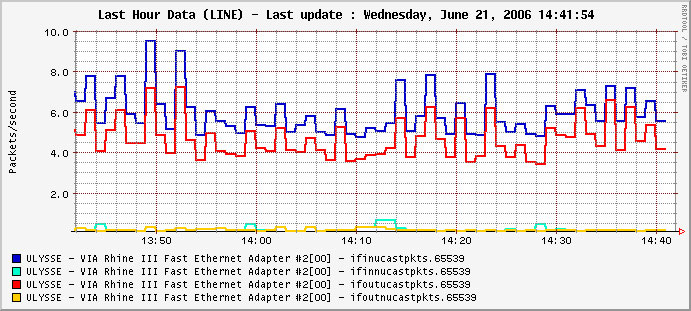
A single graph can show different DS (Data Sources) from one RRD database. It is also possible to show the values from more than one RRD databases into a single RRD graph.
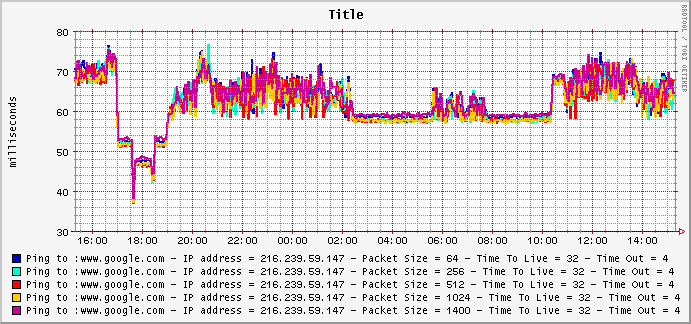
Example of graph realized with RRD Collector and RRD tool that display ping response time.
Often, it is necessary to perform some math on the values retrieved from database, before plotting them. For example, in SNMP replies, memory consumption values are usually specified in KBytes and traffic flow on interfaces is specified in Bytes. Graphs for these values will be more senseful if values are represented in MBytes and mbps. the RRDTool graph command allows to define such conversions.
Apart from mathematical calculations, it is also possible to perform logical operations such as greater than, less than, and if then else.
If a database contains more than one RRA archive, then a question
may arise - how does RRDTool decide which RRA archive to use for retrieving
the values? RRDTool takes looks at several things when making its choice.
First it makes sure that the RRA covers as much of the graphing time frame as
possible.
Second it looks at the resolution of the RRA compared to the resolution of the
graph. It tries to find one which has the same or better resolution. With the
``-r'' option you can force RRDTool to assume a different resolution than the
one calculated from the pixel width of the graph.
Values of different variables can be presented in 5 different shapes in a graph - AREA, LINE1, LINE2, LINE3, and STACK.
Another important thing to note, is that variables are plotted
in the order they are defined in graph command. So, care must be taken to define
STACK only after defining AREA/LINE. It is also possible to put formatted comments
within the graph. Detailed instructions be found under graph manua
|